The Concept
TDR Prism is a precise frequency analyzer with a focus on human perception. Among its flexible audio sourcing, decoding, and visual configuration possibilities, Prism features a wide range of spectral weighting/tilting methods, peak/RMS smoothing options, including human auditory filters, and real-time indication of auditory masking.
Prism is able to visualize and compare spectra from various sources, be it audio files, regular and sidechain inputs, or other Prism instances in the project.
A freely resizable user interface with fullscreen support offers comfortable insight into the spectrum. Screen magnification, automatic marker lines, and tone generator options further help inspect audio signals with ease.
Prism Controls
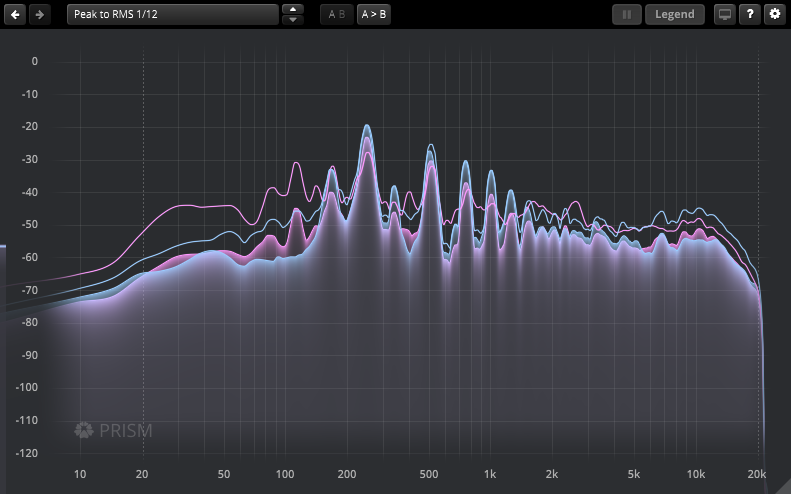
Filter Magnitude Display
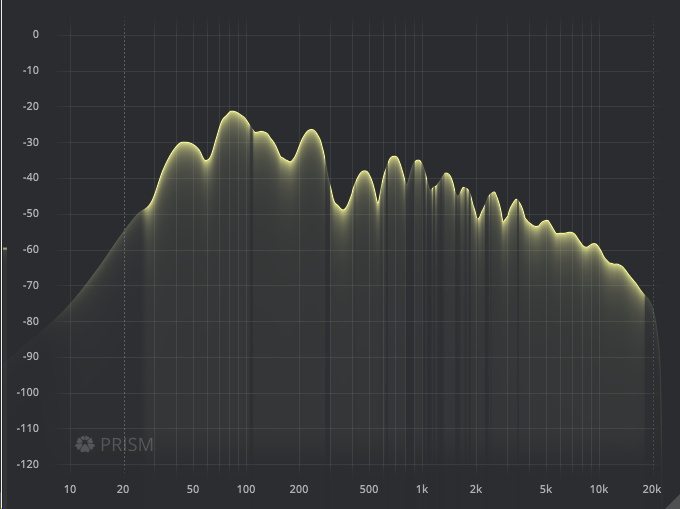
This panel displays the frequency analyzer graph.
To magnify the view 4x, hold Shift. To scroll the graph on the horizontal axis, hold Shift and drag left or right.
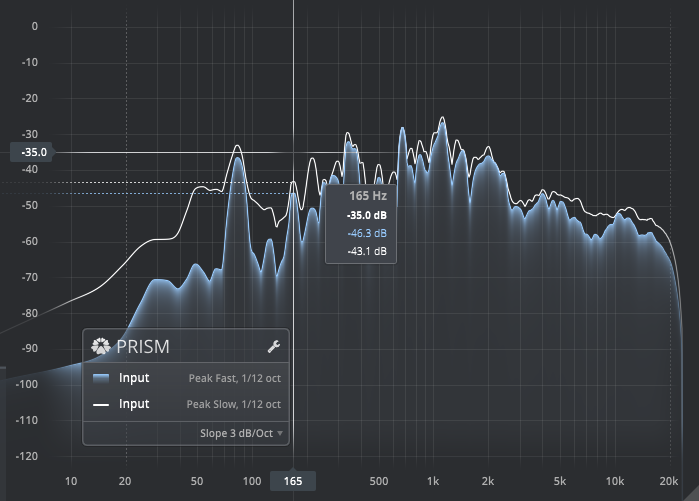
Click the display to freeze the animation and examine the spectrum in detail. This action reveals a crosshair, enabling a detailed examination of the spectrum, including dynamic reference lines for all crossing points. To play a sine wave at the selected frequency, use Ctrl+click (Windows), Command+click (macOS).
Right-click on any blank area within the UI to open the standard context menu and access additional options. Click outside the menu to close it.
DC Level Indicator
 | This meter estimates the input’s DC level. Note: Detecting DC in finite-length signals has limitations and may occasionally produce false positives. |
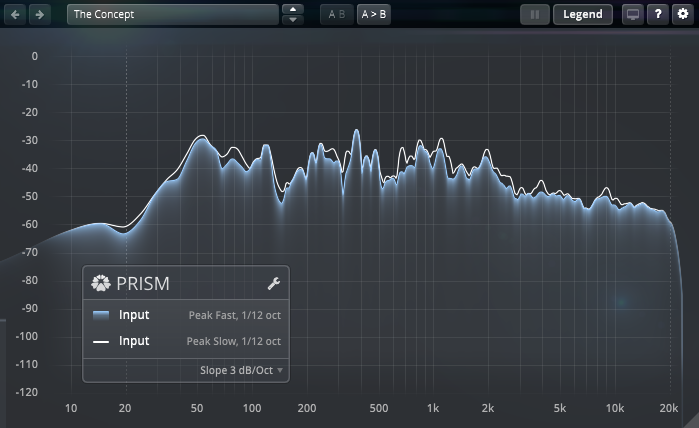
Plot Legend and Configuration
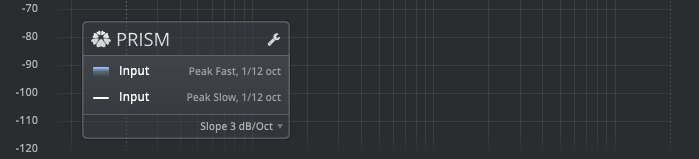
The Plot Legend provides a compact overview of all visible plots along with their most relevant settings.
You can drag the legend to your preferred location. The toolbar’s “Legend” switch allows you to hide the legend entirely. There’s also an option to automatically hide the legend while inspecting the spectrum (i.e., when the left mouse button is pressed). This option, named “Inspection (Mouse Down): Hide Legend,” is available in the context menu.
Plot Configuration
| Click to enter or exit the Plot Configuration panel. Alternatively, you can double-click the panel. |
Plot Configuration Panel

The Plot Configuration Panel provides a range of configuration options. TDR Prism can display up to four plots simultaneously. Each plot can be independently sourced, decoded, detected, averaged, and styled.
The footer section also provides access to the overall analyzer precision/timing, a range of spectral weighting options, indication of auditory masking, and the vertical display range.
Plot Active
| Select to display the plot. Deselect to hide the plot. |
Plot Source
Defines the source of the plot:
|
Plot Decoding
Defines the decoding method used for stereo sources:
|
Plot Detection
Defines the plot’s detection mode:
|
Plot Detection Timing
Controls the timing of the selected plot detection mode:
|
Plot Spectral Smoothing
Controls the spectral grouping/averaging to be applied to the plot:
|
Plot Color
| This option allows you to select a color for the plot. Note: The options ‘Spectrum’, ‘Warm Spectrum’, and ‘Cold Spectrum’ allow the plot’s visual style to be displayed in a multi-color gradient. |
Plot Style
Choose the visual style for the plot from the following options:
|
Analyzer Maximum
| This setting specifies the maximum value for the analyzer in decibels (dB). |
Analyzer Range
| This setting specifies the analyzer’s vertical range in decibels (dB). Vertical range can also be changed using the mouse wheel over the analyzer’s vertical ruler area. |
System Bandwidth
| This setting configures the analyzer range to cover the entire system bandwidth, from DC (direct current) to Nyquist frequency. |
Auditory Bandwidth
| This setting configures the analyzer range to cover the auditory bandwidth, from 20 Hz to 20 kHz. |
Auditory Masking
| Activates the Auditory Masking visualization. Masked areas will then appear semi-transparent. Note: This option has no effect on spectra imported/generated from external files (masking is largely a momentary effect). |
Auditory masking occurs when the perception of one sound is affected by the presence of another sound.
TDR Prism estimates auditory masking by using the mechanism described in ISO/IEC 13818-7 (AAC, i.e. Advanced Audio Encoding). While this is not a complete model of auditory masking, it provides sufficient accuracy for excellent lossy audio compression. Building on the same mechanisms, Prism can accurately visualize the masking predicted by lossy compression algorithms, such as the bands that these algorithms are likely to truncate.
Masking density provides a measure of the redundancy of an audio signal and its intelligibility. High masking activity is also known to induce listening stress and fatigue.
Details on the causes and effects behind auditory masking can be found in this Wikipedia article.
Invert Masking
| Inverts the masking visualization to show only the masked spectrum. |
Analyzer Weighting
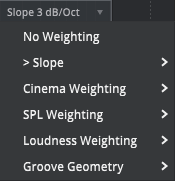 | A weighting curve is used to ‘weight’ measured values according to their importance in relation to some outcome. Prism supports several forms of weighting. |
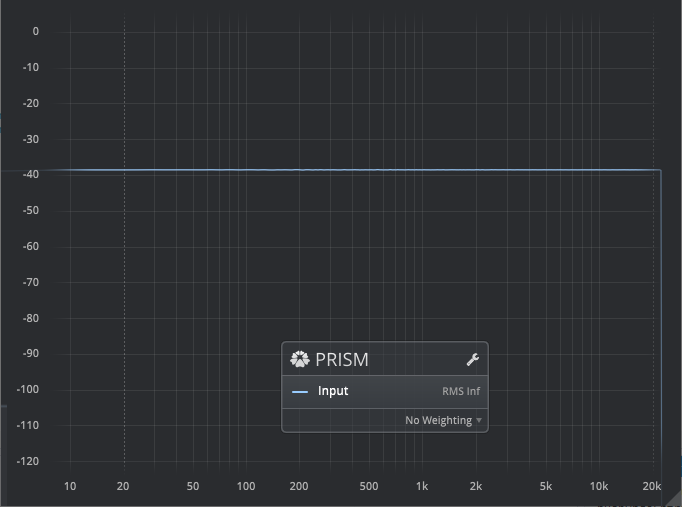
No Weighting
Flat transfer of all measured data.
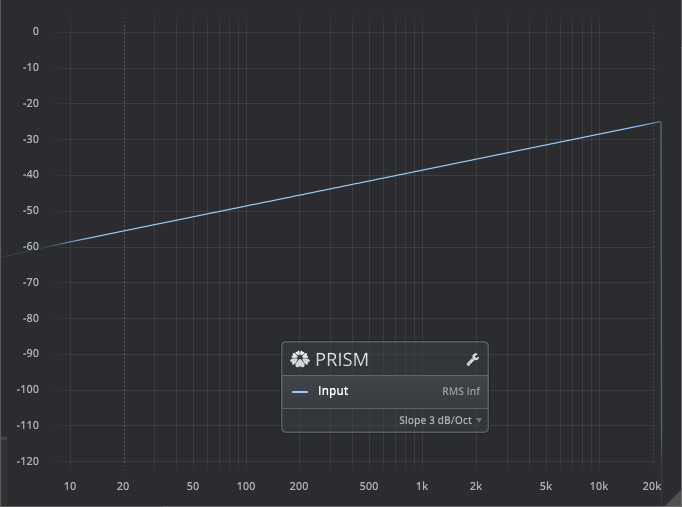
Slope (Tilt)
Linear weighting, at various slopes. These are useful in music production to visually linearize the naturally tilted frequency distribution of most music signals.
A slope of 3dB/Octave is equivalent to an inverse pink noise slope. A slope of 4.5dB/Octave is a commonly used starting point.
Cinema: X-Curve Weighting
The X-Curve, a slightly controversial standard, aims to predict the effect of large room acoustics in typical cinema applications. In other words, it helps preserve the overall frequency balance and intelligibility of dialogue across theatres. See ISO2969 for more details.
Prism implements the inverse X-Curve.
Cinema: N-Curve Weighting
The N-Curve, a variant of the X-Curve, is suitable for very large-scale rooms.
Prism implements the inverse N-Curve.
Sound Pressure Level: A-Weighting
A standard audio weighting curve, primarily intended for use in lower level SPL measurements. For more information, please refer to the A-weighting article on Wikipedia.
Sound Pressure Level: B-Weighting
A standard audio weighting curve, primarily intended for use in moderate level SPL measurements. For more information, please refer to the B-weighting article on Wikipedia.
Sound Pressure Level: C-Weighting
A standard audio weighting curve, primarily intended for use in high level SPL measurements. For more information, please refer to the C-weighting article on Wikipedia.
Sound Pressure Level: D-Weighting
A standard audio weighting curve, developed to measure sound pressure levels of very high level noisy signals, particularly those produced by turbojet engines. For more information, please refer to the D-weighting article on Wikipedia.
D-Weighting has largely been replaced by ITU-R 468 Weighting.
Loudness: ITU-R 468
ITU-R 468 is a widely used standard for measuring noise in audio systems. The human ear exhibits different responses to tonal content as opposed to noisy content. This curve can be seen as the noise equivalent to the famous (pure tone) equal loudness curves.
Loudness: ISO 226
Inverse equal-loudness contour for pure tones at 80 Phon, as per ISO 226.
Loudness: K-weighting
The K-weighting curve is used for program loudness measurements in the broadcast context, as suggested by ITU-R BS.1770 and used by EBU R-128.
Groove Geometry: Placement
Signal to disc groove placement.
Groove Geometry: Velocity
Signal to disc groove velocity.
Analyzer Precision
This defines the global spectral precision vs timing of the analyzer:
|
Toolbar

Undo/Redo
| Use the undo/redo buttons to recall previous/next parameter changes. The exact event is shown in a tool tip. Please note that certain parameter changes are not tracked by this function (e.g. “Bypass”). |
Preset Management
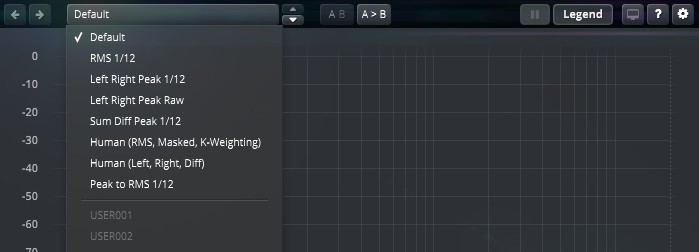
The preset drop-down list offers quick access to factory settings and user presets.
| The next/previous buttons allow you to cycle through the presets. |
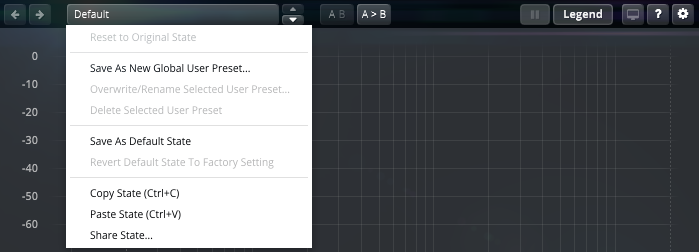
Advanced preset management options are available from the context menu (Right-click).
Reset to Original state resets the currently active preset to its original state.
Save As New Global User Preset opens a dialog used to create User Presets. Note that these presets persist across sessions and DAWs (presets are saved on your machine). The total amount of user presets is limited to 20.
Overwrite/Rename Selected User-Preset allows to overwrite or rename presets.
Delete Selected User Preset allows to delete the current user preset.
Save As Default State replaces the plugins’ default preset with the current parameter state.
Revert Default State To Factory Setting deletes an overwritten default state.
Copy State (Ctrl+C) copies the current control states to the clipboard. This allows for applying control states (i.e. “presets”) across plugin instances and plugin hosts by using the Paste State command.
Paste State (Ctrl+V) pastes the control states from the clipboard.
Share State opens a dialog with additional preset sharing options via e-mail or internet forums.
A/B Control
| A/B allows to compare two alternative parameter states. |
| A>B and B<A copies one state to the other. |
Pause
| This feature freezes the animation, allowing for a more detailed examination of the spectrum. |
Legend
| This function toggles the visibility of the Plot Legend. |
Fullscreen Mode
| This button enables the plugin’s interface to expand to full screen, facilitating precise adjustments and providing a more detailed view of the Filter Magnitude Display. To exit Fullscreen Mode, either press the Escape key or click the Fullscreen button again. |
Help
| The dynamic help mode offers detailed information about the various elements of the user interface. Click “?” to activate the online help and move the mouse cursor over the control of interest. A small info bubble will appear displaying the function and details of the item. |
Settings
| The settings button opens a dialog which gives control over additional plugin options. |
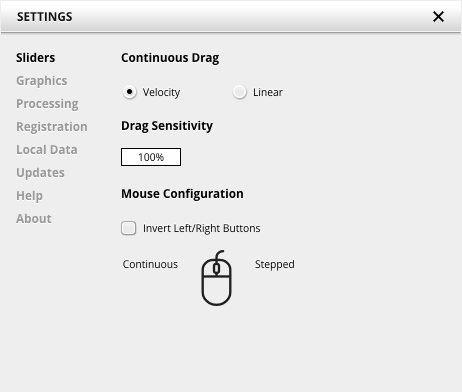
Slider allows for changing the behavior of knobs and control points in response to the mouse. Under Continuous Drag, knob and controller movement relies on mouse speed when Velocity is enabled. When Linear is enabled, knob and controller movement is proportional to mouse movement. Drag Sensitivity sets the linear sensitivity of the knob and controller movement further.
Plug-in controls, knobs, and control points can be adjusted using Left-click & drag (Continuous) and Right-click & drag (Stepped) by default. Mouse Configuration swaps the Continuous and Stepped behaviors between the left and right mouse buttons when selecting Invert Left/Right Buttons. Note that the default stepped values can be customized via the product configuration file. See “Local data” below for instructions on how to access this file.
Graphics allows for changing the interface size to a fixed percentage value between 100%, 125% and 150%.
Processing shows the plug-in latency and sample rate details. Highest quality rendering enables the option to always render at the highest Processing Quality, no matter what type is enabled in the Toolbar. See the “Processing Quality” subchapter for more details on these modes.
Registration offers access to offline and online product registration options. See the “Product Registration” chapter for more information.
Local Data allows for exporting and importing user preferences, presets, and keys, to and from other systems. Local data can also be deleted for all Tokyo Dawn Labs plug-ins using the Trash button.
In addition, the Folder button opens the Tokyo Dawn Labs local data folder containing all configuration files and keys. Note that these operations affect all TDR plug-ins, and not just SimuLathe REF.
Updates allows to Check for updates and to Download latest version. Automatic Lookups can be enabled to Check for updates (once per day).
Help contains Documentation and Support links.
About shows the version number, build date, format, credits, and other information.
Context Menu
Standard Context Menu
Additional options can be accessed using the standard context menu. This can be opened by Right-clicking on a blank area anywhere in the UI. A click outside of the menu closes it.
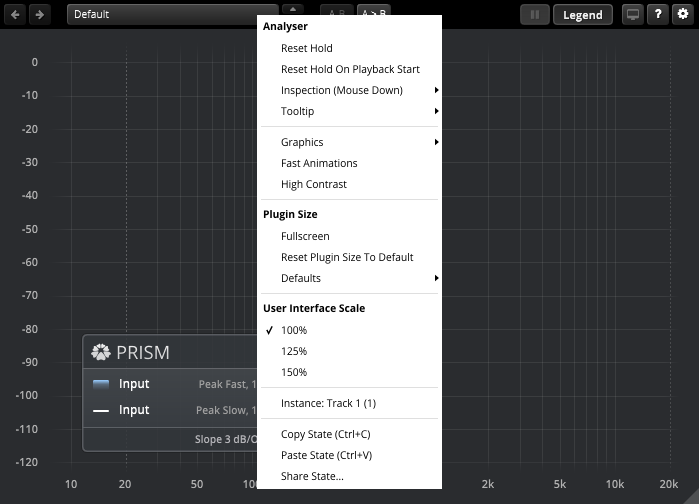
Analyzer
The Analyzer feature offers further options for managing the spectrum animation in the Filter Magnitude Display:
Analyzer: Reset Hold
This clears all Peak/RMS hold values. This effect is particularly noticeable in Infinite mode.
Analyzer: Reset Hold On Playback Start
This option clears all Peak/RMS hold values when playback starts. This effect is particularly noticeable in Infinite mode.
Analyzer: Inspection (Mouse Down)
The Inspection (Mouse Down) feature provides additional inspection options when you activate the crosshair on the Filter Magnitude Display:
Analyzer: Inspection (Mouse Down): Hide Legend
This option toggles the visibility of the Plot Legend when you activate the crosshair.
Analyzer: Inspection (Mouse Down): Freeze Plots
This feature pauses the spectrum animation, allowing for a more detailed examination when you activate the crosshair.
Analyzer: Inspection (Mouse Down): Play Tone with CTRL Key (Win), Play Tone with COMMAND Key (macOS)
This option activates a tone generator at the selected frequency when you press Ctrl+click (Windows) or Command+click (macOS) on the Filter Magnitude Display.
Analyzer: Inspection (Mouse Down): Tone Generator Mode
When you initiate the Play Tone with CTRL Key (Win) or Play Tone with COMMAND Key (macOS) feature, you have four modes to choose from:
- Static Sine: Generates a static sine wave at the chosen frequency.
- Dynamic Sine: Generates a dynamic sine wave at the chosen frequency.
- Dynamic Noise: Generates dynamic white noise at the chosen frequency.
- Bandpass: Enables bandpass monitoring at the chosen frequency.
Analyzer: Tooltip
Tooltip offers extra features that display the nearest musical note when you engage the crosshair on the Filter Magnitude Display:
Analyzer: Tooltip: Show Note
This feature displays the musical note that is closest to the frequency currently under the crosshair on the Filter Magnitude Display.
Analyzer: Tooltip: A4 Tuning
This option allows you to adjust the reference pitch of the note, typically set at 440 Hz. You can use this setting to accommodate various tuning standards.
Graphics
This selection offers two quality modes for GPU performance:
- Efficient: Ideal for systems with limited GPU resources.
- High Quality: Ideal for systems with abundant GPU resources and when maximum detail is desired.
Fast Animations
This feature accelerates the spectrum animation in the Filter Magnitude Display.
High Contrast
This option slightly darkens the background of the user interface.
Plugin Size
Plugin Size provides additional options for adjusting the interface size of the plugin:
Plugin Size: Fullscreen
This feature allows the plugin’s interface to expand to full screen. To exit Fullscreen, you can select ‘Exit Fullscreen’ from the Context Menu, press the Escape key, or click the Fullscreen button on the Toolbar.
Plugin Size: Reset Plugin Size To Default
This allows you to revert the interface size of the plugin to its original setting, as defined under Defaults.
Plugin Size: Defaults
This option provides two additional settings:
- Use This Plugin’s Size As New Default: This setting allows you to set the current size of the plugin as the new default size.
- Revert To Factory Settings: This setting allows you to restore the plugin size to its original factory settings.
These options provide flexibility in customizing the plugin’s interface size according to your preferences.
User Interface Scale
User Interface Scale sets the on-screen interface size to a fixed percentage value of 100%, 125%, or 150%.
Instance
Instance allows for renaming the specific plug-in instance.
Copy State (Ctrl+C) copies the current control states to the clipboard. This allows for applying control states (i.e. “presets”) across plugin instances and plugin hosts by using the Paste State command.
Paste State (Ctrl+V) pastes the control states from the clipboard.
Share State opens a dialog with additional preset sharing options via e-mail or internet forums.
Adjusting Plugin Controls
Resetting Controls to Default Preset Values
Any control can be reset to its default preset value. This default value is the value that is set in the Default preset.
To reset a control:
|
Modifying Controls Using a Mouse Wheel
Many of the displayed values can be modified directly using a mouse wheel.
To modify control values using a mouse wheel:
|
Plugin Window Resize
| Adjusts the interface size of the plugin by clicking and dragging the resize handle. |
Copyright and Acknowledgements
Prism was originated by Vladislav Goncharov and Fabien Schivre
Documentation by Shane Johnson
Product evaluation and quality control by:
Ady Connor
Aleksi Vuolevi
Andrew Boult
Audiobomber | Castlemastering
Bob Olhsson
Cyril Meysson
Dax Liniere | Puzzle Factory
Dean
Dennis J Wilkins | Studio 12 Below
Diogo C. Borges
Eric Recourt
EvilDragon
Greg Reierson
Gregg | Hermetech Mastering
Helmut Erler
Ilya Orlov
Janne Hatula
Jean Dante
Jeffrey Rippe
Jerry Anthony Mateo
Joe Caithness Mastering
Joseph Lyons
Justin Perkins
Laurent Sevestre
Michael Wynne
Miro Pajic
Murray Campbell | Beatworld
Niklas Silen
Nil Hartman
Pete Grandison
Resoundsound Mastering
Rich Prewett
Richard Pentrose
Robi Bulesic
Roland Löhlbach
Ruairi O’Flaherty
Sean Diggins
Sergey Makeev
Thaddeus Moore | Liquid Mastering
Titanio Studios
Valentin Zvukofor
Vitaly Zolotarev
Copyright © Tokyo Dawn Records. All rights reserved.
All other product and company names are trademarks or registered trademarks of their respective holders.